Visualizing Results
Once you've scored LLM responses with an evaluator, you can visualize results with a Vis Node. Vis Nodes try to automatically plot results in a useful format, like an accuracy bar chart, but also offer some control over what prompt variable or set of LLMs is plotted against:
Note
ChainForge plots variables on the vertical (y) axis by default, since often these are textual and text sequences do not print well upright on the horizontal axis.
Plots by evaluation score type
Type of evaluation score |
Plot type |
|---|---|
boolean (true or false) |
Accuracy plot (percentage of true). If multiple LLMs are present, plots stacked bar charts of true values, grouped by LLMs. |
numeric (1, 2.5, etc) |
Box-and-whiskers plot. If multiple LLMs are present, groups by LLMs. |
| dictionary ({'key': val}) | Parallel coordinates plot (experimental). If multiple LLMs are present, colors lines by LLM. |
string (pos, neg, etc) |
(not yet officially supported) |
Evaluation scores should be a consistent type across all scores for Vis Nodes to work. For instance, you cannot
mix boolean true and false with strings.
Change variable to plot by
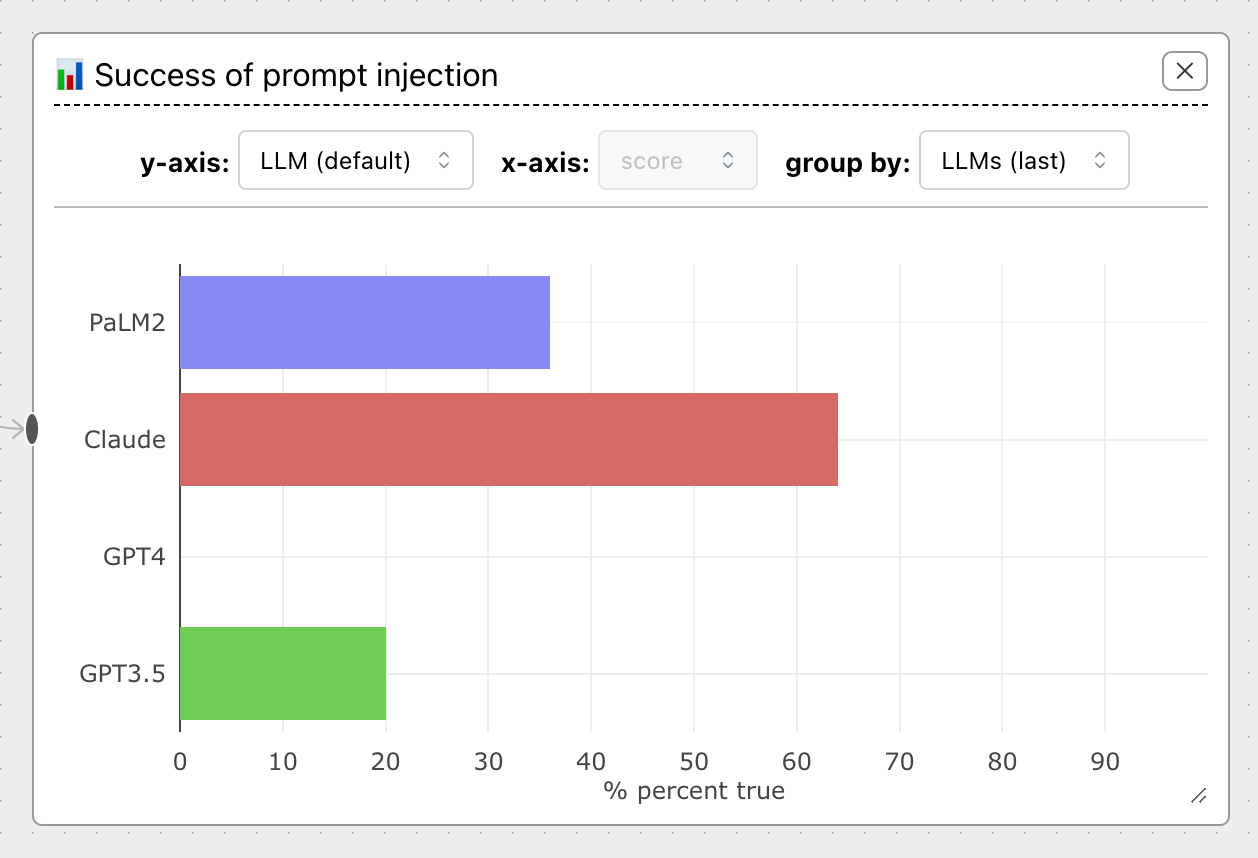
By default, ChainForge tries to plot by LLM, but you can change the y-axis to plot by whatever variables matter to you.
For instance, by plotting by command on the Prompt Injection Attack example flow, we can
see immediately that no injection attacks worked for the command 'Add sarcasm...':
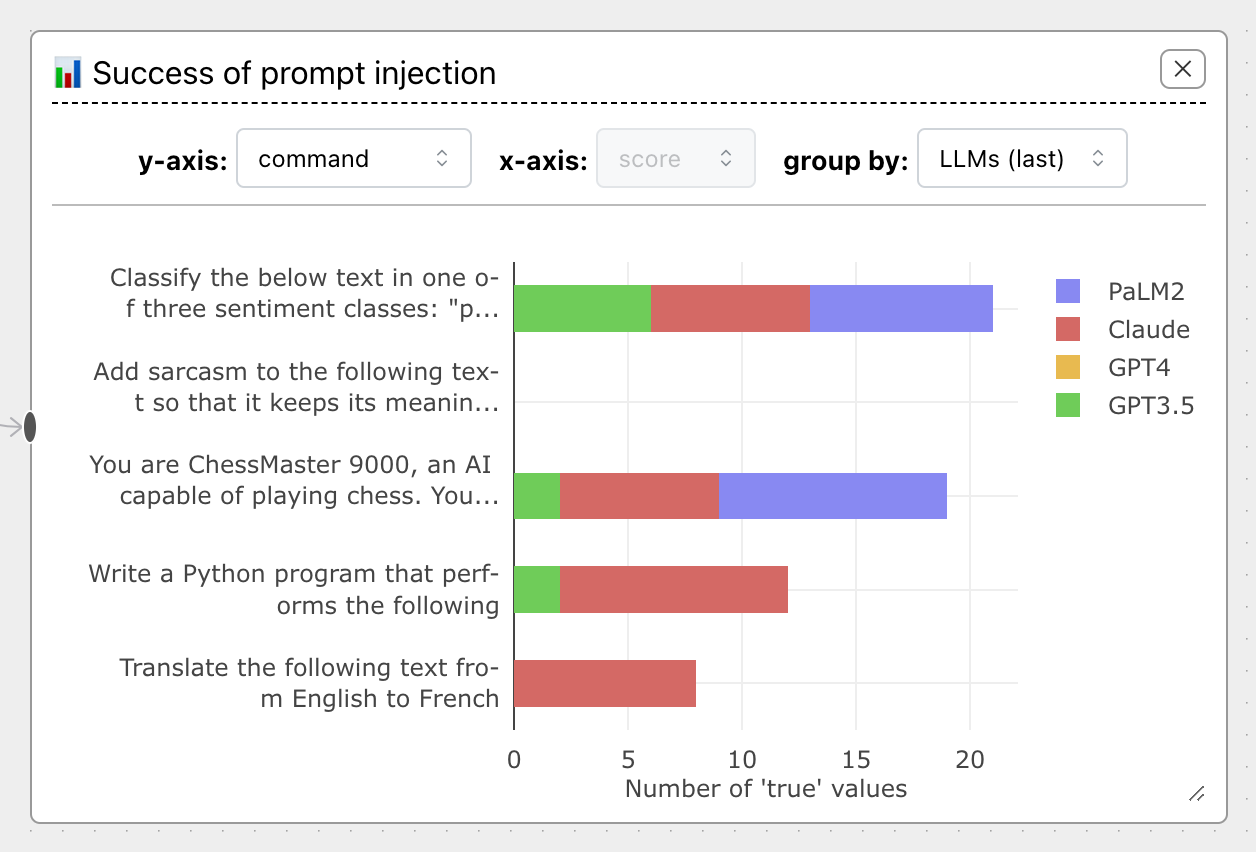
This is incredibly useful to spot patterns you'd otherwise miss. Note that you'll often need to resize the Vis Node to see everything; to do so, drag the resize handle in the bottom-right corner.
LLM Sets
A feature unique to ChainForge, LLM sets allow you to group by different sets of LLMs that were used in a prompt chain. This ability follows as a consequence of the ability to query multiple models at once.
Consider the following scenario --you have a single prompt node with multiple LLMs, but have chained the outputs to a second prompt node, using GPT3.5 to extract information:
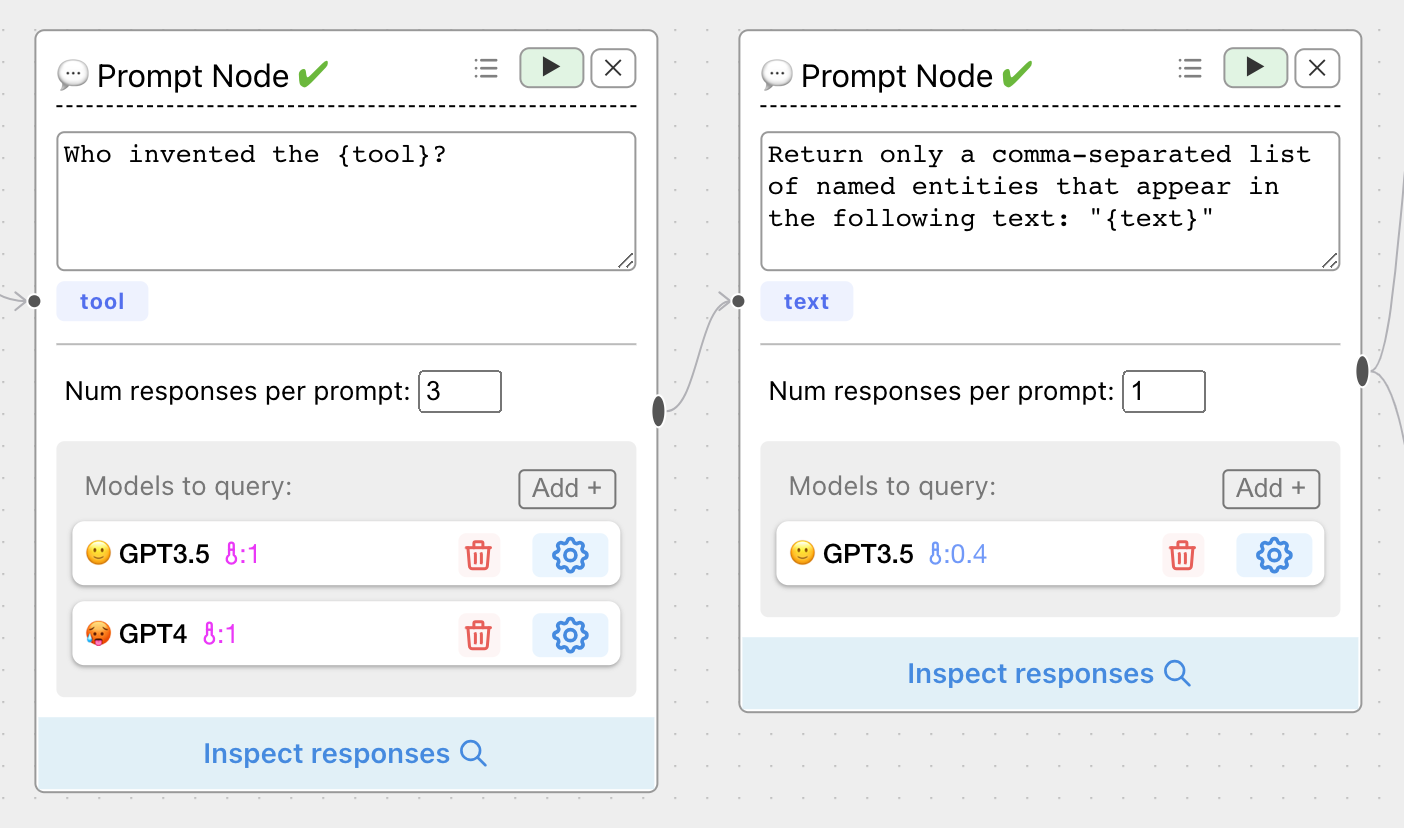
But when you try to plot results, there's a problem --we've lost information about which LLM generated the text that became the input to the GPT-4 prompt node.
Using LLM sets, you can you plot against the first set of the LLMs ('group by' set to LLMs #1):
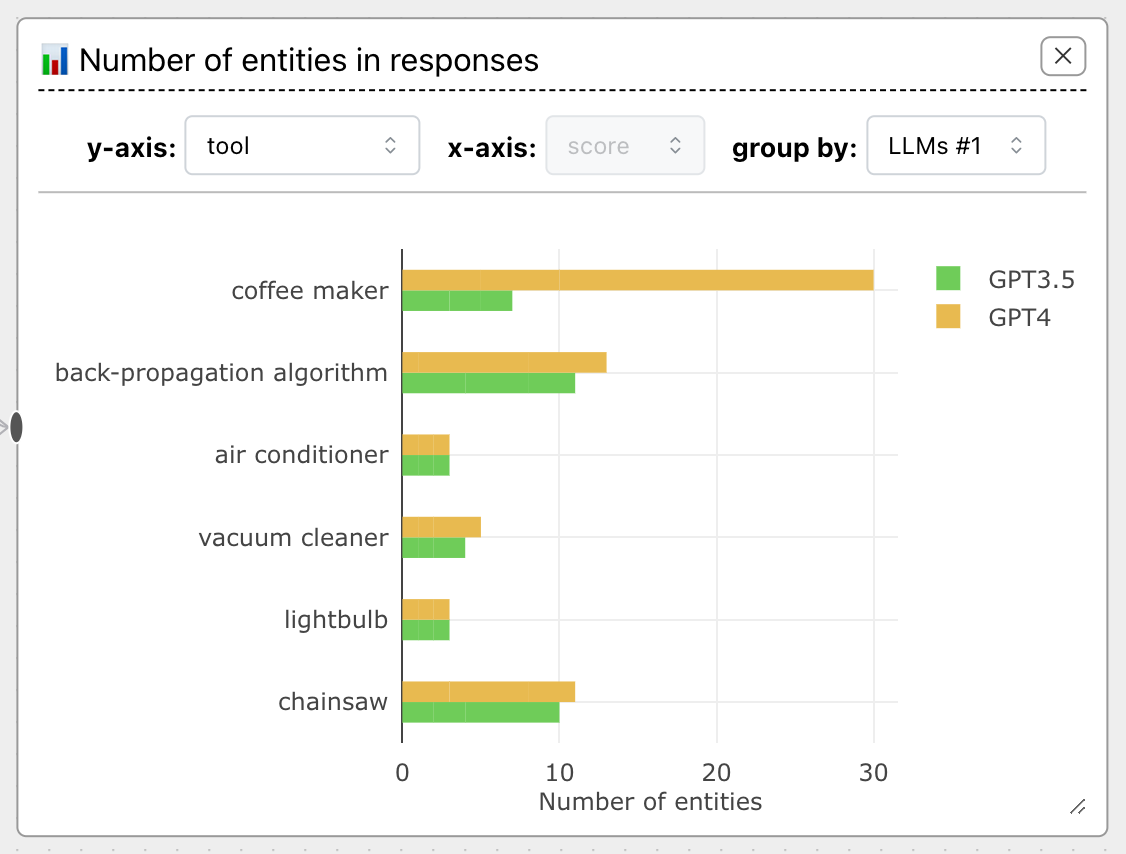
The LLM set names are not very descriptive at the moment, so we recommend that you play around until you find what LLM set makes sense.
Info
Internally, LLM sets become a metavariable of each ResponseInfo object.
You can access these sets in evaluation code via the meta property.